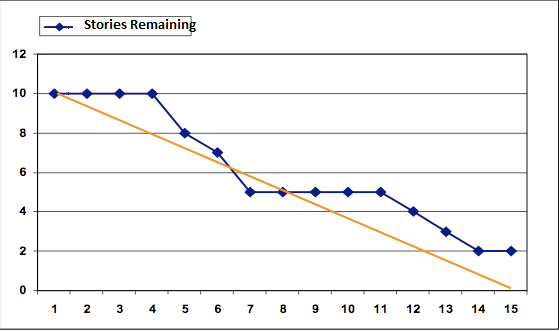
 Sprint burn-down - Scrum teams organize development into time-boxed sprints. At the outset of the sprint, the team forecasts how much work they can complete during a sprint. A sprint burn-down report then tracks the completion of work throughout the sprint.
Cumulative Flow Diagram – This will help Kanban team especially for team working outside scrum team to limit work in progress (WIP). Limiting WIP will help team to focus on assignment that has been already initiated.
 Release burn-down - Epic and release (or version) burn-down charts track the progress of development over a larger body of work than the sprint burn-down, and guide development for both scrum and Kanban teams. Since a sprint (for scrum teams) may contain work from several epics and versions, it's important to track both the progress of individual sprints as well as epics and versions.
Defect ratio – This will help to establish number of defects per story/feature/epic based on defect logged in by business/product owner.
Cycle time - Teams with shorter cycle times are likely to have higher throughput, and teams with consistent cycle times across many issues are more predictable in delivering work. While cycle time is a primary metric for Kanban teams, scrum teams can benefit from optimized cycle time as well.
Reach to me on naveenhome@gmail.com or +91 9810547500 for corporate training.
We deliver training on Test Driven Development (TDD), Behavior Driven Development (BDD), Cucumber, Selenium, Jira Agile, Scrum, Jenkins, Scrum Master, Scrum Developer, Product owner, agile estimation and planning, writing user stories etc.
No comments:
Post a Comment